Cheap electricity prices and grid access fees push our solar panel payback period to greater than 20 years. Local fuel sources for electricity generation and energy losses in generating electricity complicate calculations on reduction of carbon footprint by going all electric.
A recent meeting with our electricity provider, Peoples Energy Cooperative (PEC) shed a new light on the difficulty of incorporating distributed generation systems (DGS, wind and solar) into the energy mix of electricity providers. PEC provides electricity to rural customers in our area and previously had two modes of recouping fees for obtaining and distributing electricity to its customers. These were a base monthly fee (37$) and a fee per kWH used (~0.11$ per kWH). However the 35$ base fee did not cover the entire cost of distribution (~60% of cost) with the remaining embedded within the per kWH used (~40%). The benefit of such a system from an environmental view is it incentivizes users to reduce their usage by keeping kWH more expensive. However, with Net-metering laws passed by many legislatures, the power companies were required to purchase excess electricity generation by DG systems at the retail rate (same rate they charge for electricity) rather than at the wholesale rate (rate they generate or purchase electricity). This means many DG systems were netting their kWH usage to zero for the year, and therefore the electricity providers were not recouping the embedded distribution cost from the electricity usage fee. As a consequence electric companies lobbied and were successful in many legislatures (including Minnesota) to incorporate a “Grid Access Fee” to DGS owners. The addition fees increased our solar panel payback time period
to > 20 years for our system, significantly longer than those quoted for high solar production, high $/kWH states like California where payback might be 6-10 years Here are our numbers.
Size of System – 9.8 kW
Cost of System – $30840
Federal Rebate (30%) – $9252
Final Cost of System – $21588
Cost of System per watt installed – $2.20
Predicated Annual Production – 11200 kWH
PEC Cost per kWH – 0.11$
Rest of calculation assumes we use approximately as much as we produce (net zero).
Saved $ by being net zero (11200 kWH times 0.11$) = $1232
Basic Monthly Service Charge – $37.00
Monthly Grid Access Fee – $24.31
Calculation is ((Money Saved)-(Yearly Fixed Costs)) x # of years) = Cost of System
Three grid tied calculations based on
- No yearly fixed costs (cant eliminate monthly service charge unless you are off grid anyway, and what if they did not charge the grid access fee)
- Only grid access fee (see #1)
- Include all yearly fixed costs.
- $1232 savings times X years = $21588 (payback = 17.5 years)
- ($1232 – $291.72) times X years = $21588 (payback = 23 years)
- ($1232 – $735.72) times X years = $21588 (payback = 43.5 years)
To alleviate the gripes of DGS owners the PEC is discussing moving all of the distribution costs into the basic monthly service charge. In this case the payback period would be 17.5 years (although this raises fixed costs that cant be eliminated so on net examples 1 and 2 result in the same amount of money spent for kWH obtained), whereas currently the payback period is 23 years with the monthly grid access fee for DGS customers. If the system could be converted into an off the grid architecture, then the minus sign in example 3 turns into a positive sign and the payback period drops to 11 years. This however would entail significant $$$ for battery storage, and would be difficult in the winter months were electricity use is high (heating) and solar production is low. So for our system payback time is between 17.5 and 23 years. Not a great return on investment, but we converted to an all electric house and the usage of solar panels for many other reasons.
- Reduce carbon footprint
- Eliminate combustion in house for cleaner air
- Reduce distribution costs to one provider
- Eventually pair with batteries and electric car
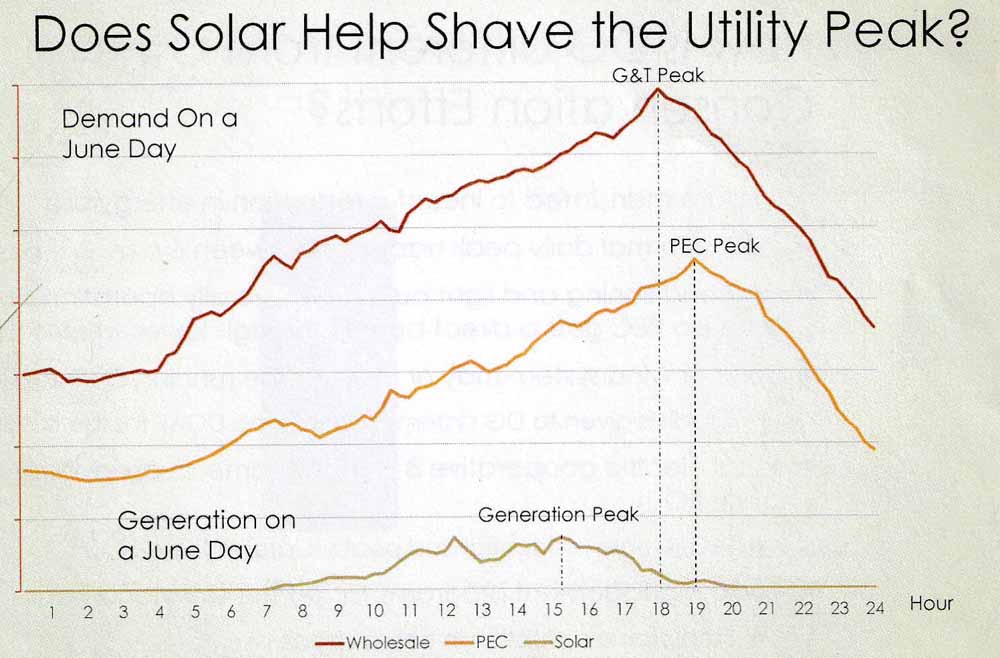
As a DGS owner we did not feel much love from our electricity provider and felt like they only put up with us because they are mandated by the state through net-metering laws. From their point of view, DGS owners do not reduce the cost of production or number of power plants required to produce electricity as DGS owners do not produce power reliably (sun does not always shine, wind does not always blow) nor is DGS power produced at the peak load.

For rural systems that don’t have a significant industrial component, the peak load comes between 5 and 8 o’clock PM when people get home from work and turn on all of their appliances.
Complicating things further is that most of the solar power of a grid tied system is not used by the DGS owner but is fed into the grid during daylight hours and “normal” electricity is pulled from the grid by the DGS owner the other 12-18 hours of the day. Therefore, the DGS owner actually uses mostly power plant generated electricity, not solar panel generated electricity. In states without hydroelectric, nuclear or significant natural gas use, the “normal” electricity can be quite dirty and inefficient.
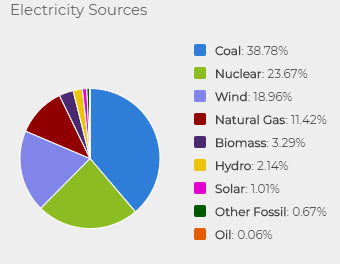
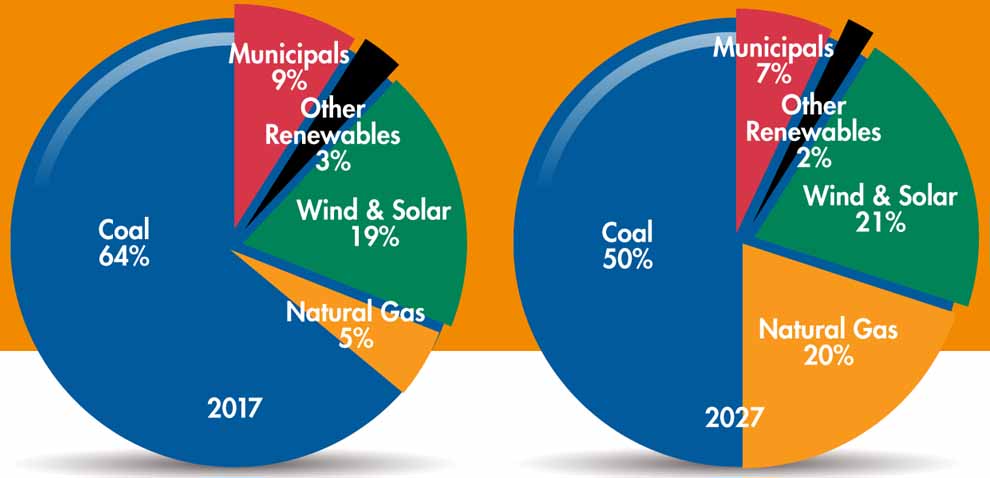
Here is a pie chart of how electricity is generated in Minnesota, and how electricity is generated by the Dairyland Electrical Cooperative (a major supplier of PEC energy).


Dairyland Electrical Cooperative Electricity Generation
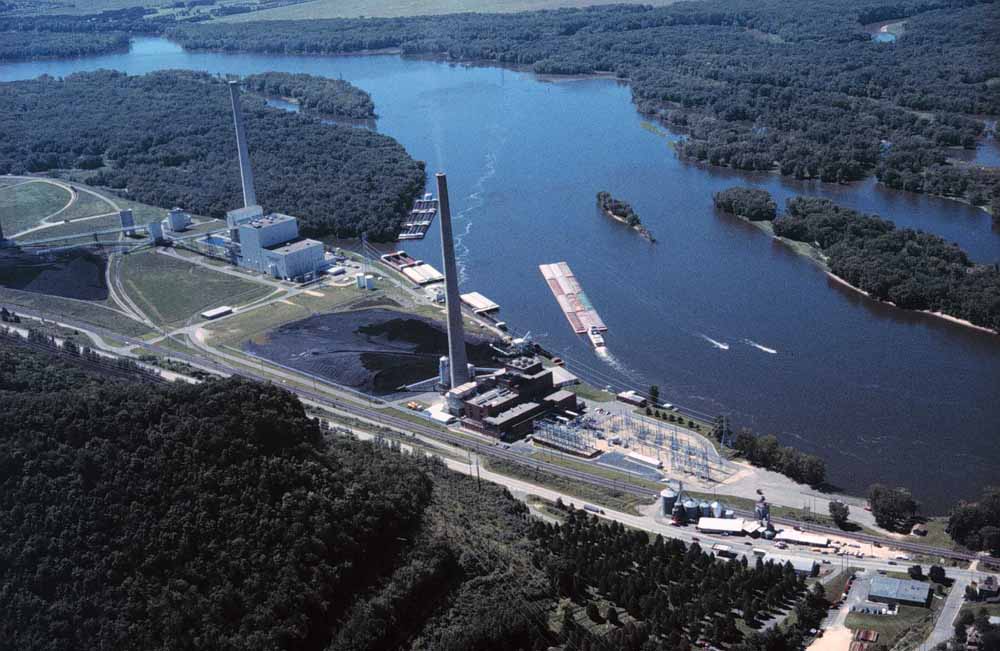
Wow, so in 2017 DEC generated 64% of its electricity with coal. A recent brochure for the DEC Alma power plant located in Alma Wisconsin (which we have driven by several times on trips along the Minnesota/Wisconsin border) reads “The Alma Site (Alma Units 1-5 and JPM) burns blended coal that arrives by barge, train and truck from Wyoming and Utah. The barge coal moves by train to St. Louis and then up the Mississippi River about 575 miles to Alma. After being crushed, the coal is fed into coal mills, also called pulverizers, where it is ground into a fine powder. The pulverized coal is then burned in the boilers to generate steam. The entire steam cycle operates to rotate the turbine shaft, which is connected to the shaft of the electric generator. The rotation of the generator by the turbine is the origin of electric energy.”

And generating electricity through the burning of fossil fuels (coal, natural gas, oil) is a tremendously wasteful process with only 1/3 of the embeded energy within the fuel being realized as electrical energy.
The U.S. energy information administration calculates energy losses using British Thermal Units (BTU) and a “heat rate”, the number of fossil fuel derived BTUs to generate a kWH of energy. As stated on the website “To express the efficiency of a generator or power plant as a percentage, divide the equivalent Btu content of a kWh of electricity (3,412 Btu) by the heat rate. For example, if the heat rate of a power plant is 10,500 Btu, the efficiency is 33%. If the heat rate is 7,500 Btu, the efficiency is 45%”
Coal and oil had heat rates of 10465 and 10834 in 2017 (~33% efficiency) while natural gas had a heat rate of 7812 ( ~43% efficiency).
From a general point of view it does not matter that we do not directly use our solar energy, as we are putting 100% clean energy into the grid for someone to use and that does eliminate the use of a corresponding amount of “dirty” electricity even if that does not come at peak load for the electric company. However, in going electric we eliminated direct on-site usage of natural gas for heating, hot water and laundry (dryer) and utilizing natural gas most likely would have a smaller carbon footprint than using “dirty” electricity. For example high efficiency gas furnaces are available that utilize up to 95% of the embeded energy while the most efficient conventional gas-fired storage water heaters are ENERGY STAR models with energy factors between 67% and 70%. So essentially we exchanged the possibility of utilizing mechanicals with 65 to 95% efficiency (on site natural gas) with mechanicals that are 33-45% efficient (grid generated electricity).
Now before one throws in the towel and says “what am I doing!”, there are ways to put everything back in balance and remain with an all electric house. Air source (or ground if you can afford it) heat pumps are available which increase the efficiency of electric mechanicals by 200-300% and therefore make them equally if not more efficient than natural gas. Essentially they use electricity to take heat out out of the air (using refrigerant technology) so that for every 1 BTU you put into the system you get 2-3 BTUs out (almost magical). Systems are now available that function down to -15 degrees F.
See our blogs on our Heat Pump water heater and Mitsubishi ductless minisplits.
Matt,
Very nice article! I didn’t see the inflation value for electricity rates. I think electricity will increase quite a bit in the future and solar locks in your rate. A minimal 5% inflation would be conservative and I think this is what utilities use in the infrastructure plans.
Ivan
Thanks Ivan,
Yeah, I think I will include inflation in another blog post and other cost savings/benefits….. house value, saving on natural gas / propane storage and distribution fees.. etc.
Matt